Explore your Apple Watch heart rate data in R
I’ve had an Apple Watch since last May, and was recently curious as to whether I could access the heart rate sensor’s data outside of the Health app. It turns out you can export your health data into an XML file and explore it with R.
Step 1: Export your data from Apple’s Health app
You’ll first need to export your health data from Apple’s Health app. First, open the Health app and tap the Health Data icon at the bottom. Tap All and then the Share icon in the top right. Tap Export to confirm that you want to export your data. It might take a few minutes to complete. Once it’s done, you’ll be prompted to share the data. You can use AirDrop to transfer it to your Mac, or simply e-mail it to yourself.
When you’ve saved the file on your computer, extract the ZIP file. Your health data records are stored in the file export.xml. Next, we’ll use R to explore the records.
Step 2: Import your data into R
I’ll be using Hadley Wickham’s xml2 package to import the XML file:
library(pander)
library(magrittr)
library(dplyr)
library(xml2)

records <- read_xml("data/export.xml") %>%
           xml_children

length(records)
[1] 1401269
Over 1.4 million records! In addition to regular heart rate measurements, there are a lot of additional health data records inside the file. Let’s see if we can figure out all the different types of records. We’ll first take a look at just a few:
records[10000:10004]
{xml_nodeset (5)}
[1] <Record type="HKQuantityTypeIdentifierHeartRate" sourceName="Jeff's  ...
[2] <Record type="HKQuantityTypeIdentifierHeartRate" sourceName="Jeff's  ...
[3] <Record type="HKQuantityTypeIdentifierHeartRate" sourceName="Jeff's  ...
[4] <Record type="HKQuantityTypeIdentifierHeartRate" sourceName="Jeff's  ...
[5] <Record type="HKQuantityTypeIdentifierHeartRate" sourceName="Jeff's  ...
It looks like each record has a type attribute, and HKQuantityTypeIdentifierHeartRate corresponds to the heart rate measurements we are after. Let’s see all the different record types and generate a count of each one:
record_types <- xml_attr(records, "type")

record_types %>%
  table(dnn="Record_type") %>%
  as.data.frame %>%
  arrange(desc(Freq)) %>%
  mutate(Count = prettyNum(Freq, big.mark=",")) %>%
  select(-Freq) %>%
  pander
| Record_type | Count |
|---|---|
| HKQuantityTypeIdentifierDistanceWalkingRunning | 389,841 |
| HKQuantityTypeIdentifierActiveEnergyBurned | 363,752 |
| HKQuantityTypeIdentifierBasalEnergyBurned | 277,667 |
| HKQuantityTypeIdentifierStepCount | 229,547 |
| HKQuantityTypeIdentifierHeartRate | 110,651 |
| HKQuantityTypeIdentifierAppleExerciseTime | 19,139 |
| HKCategoryTypeIdentifierAppleStandHour | 5,239 |
| HKQuantityTypeIdentifierFlightsClimbed | 3,659 |
| HKCategoryTypeIdentifierSleepAnalysis | 831 |
| HKQuantityTypeIdentifierHeight | 83 |
| HKQuantityTypeIdentifierBodyMass | 68 |
| HKQuantityTypeIdentifierBodyFatPercentage | 67 |
| HKQuantityTypeIdentifierBodyMassIndex | 67 |
That’s a lot of heart rate measurements! We’ll extract only the heart rate records and then view one of them to see what it contains:
heart_rate_records <- records[which(record_types == "HKQuantityTypeIdentifierHeartRate")]

single_record_attrs <- xml_attrs(heart_rate_records[10000])[[1]]

data_frame(attribute = names(single_record_attrs),
           value     = single_record_attrs) %>%
  pander
| attribute | value |
|---|---|
| type | HKQuantityTypeIdentifierHeartRate |
| sourceName | Jeff’s Apple Watch |
| unit | count/min |
| creationDate | 2015-05-31 13:14:51 -0500 |
| startDate | 2015-05-31 13:14:51 -0500 |
| endDate | 2015-05-31 13:14:51 -0500 |
| value | 103 |
We really only care about the date and value for each record, so let’s build a data frame and save it for use in the next step.
heart_rate_df <- data_frame(date       = as.POSIXct(xml_attr(heart_rate_records, "endDate")),
                            heart_rate = as.integer(xml_attr(heart_rate_records, "value")))
saveRDS(heart_rate_df, file="heart_rate_df.rds")
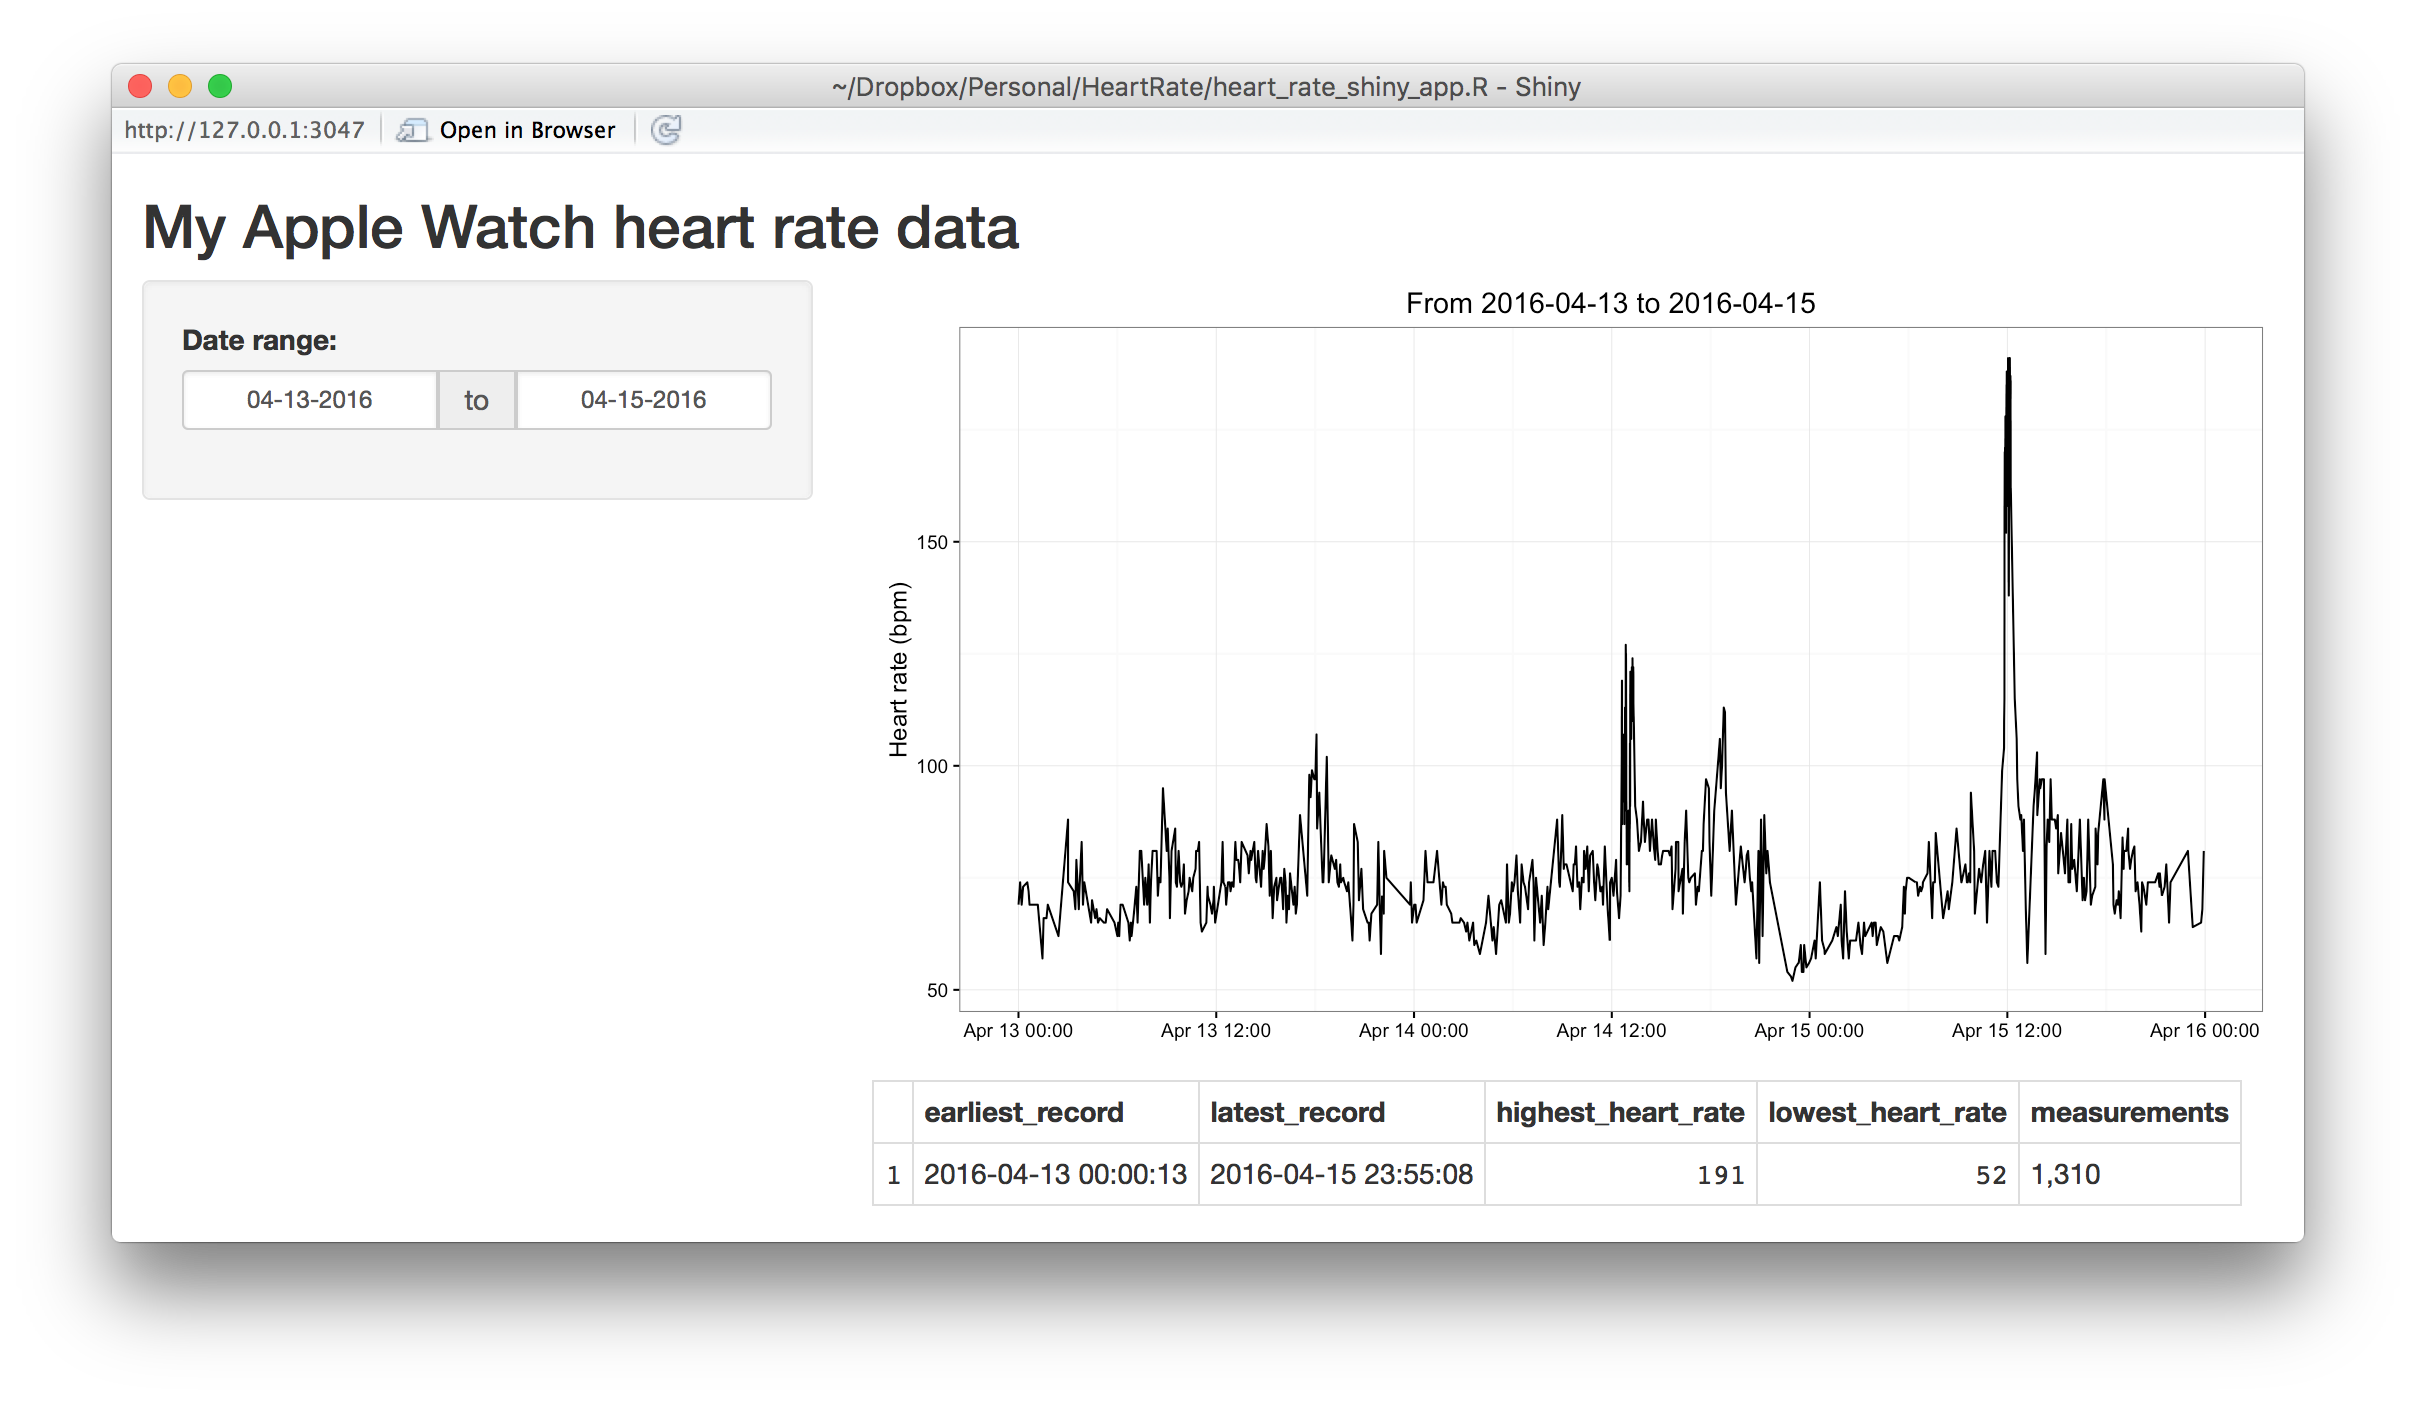
Step 3: Build a Shiny app to plot the data
To visualize the data, we’ll build a simple Shiny app that plots the heart rate data over a specified date range:
library(shiny)
library(ggplot2)
library(dplyr)
library(magrittr)
library(lubridate)

heart_rate_df <- readRDS("heart_rate_df.rds") %>%
                 mutate(date_only = format(date, "%Y-%m-%d"))

ui <- shinyUI(fluidPage(

   titlePanel("My Apple Watch heart rate data"),

   sidebarLayout(
      sidebarPanel(
         dateRangeInput("date_range", "Date range: ",
                        format="mm-dd-yyyy",
                        min=min(as.Date(heart_rate_df$date_only)),
                        max=max(as.Date(heart_rate_df$date_only)),
                        start=max(as.Date(heart_rate_df$date_only)) - days(1),
                        end=max(as.Date(heart_rate_df$date_only))
                        )
      ),
      mainPanel(
        plotOutput("heart_rate_plot"),
        tableOutput("heart_rate_table")
      )
   )
))

server <- shinyServer(function(input, output) {

  heart_rate_ranged <- reactive({
    date_ranges <- input$date_range[1:2] %>% as.Date
    date_start  <- min(date_ranges)
    date_end    <- max(date_ranges)

    heart_rate_df %>%
      filter(date_only >= date_start & date_only <= date_end)
  })

  output$heart_rate_plot <- renderPlot({
      g <- ggplot(heart_rate_ranged(), aes(x=date, y=heart_rate)) +
           geom_line() +
           theme_bw() +
           labs(x="",
                y="Heart rate (bpm)",
                title=paste0("From ", input$date_range[1], " to ", input$date_range[2]))
      g
   })

  output$heart_rate_table <- renderTable({
    heart_rate_ranged() %>%
      summarize(earliest_record    = as.character(min(date)),
                latest_record      = as.character(max(date)),
                highest_heart_rate = max(heart_rate),
                lowest_heart_rate  = min(heart_rate),
                measurements       = prettyNum(n(), big.mark=","))
  })
})

shinyApp(ui = ui, server = server)
Here’s how it looks:
A simple RMarkdown document for importing and saving your heart rate data, as well as the Shiny app above, can be found at jeffjjohnston/apple_watch_heart_rate.